Turkiye Earns $37.5 Billion from Hazelnut Exports Over the Last 20 Years
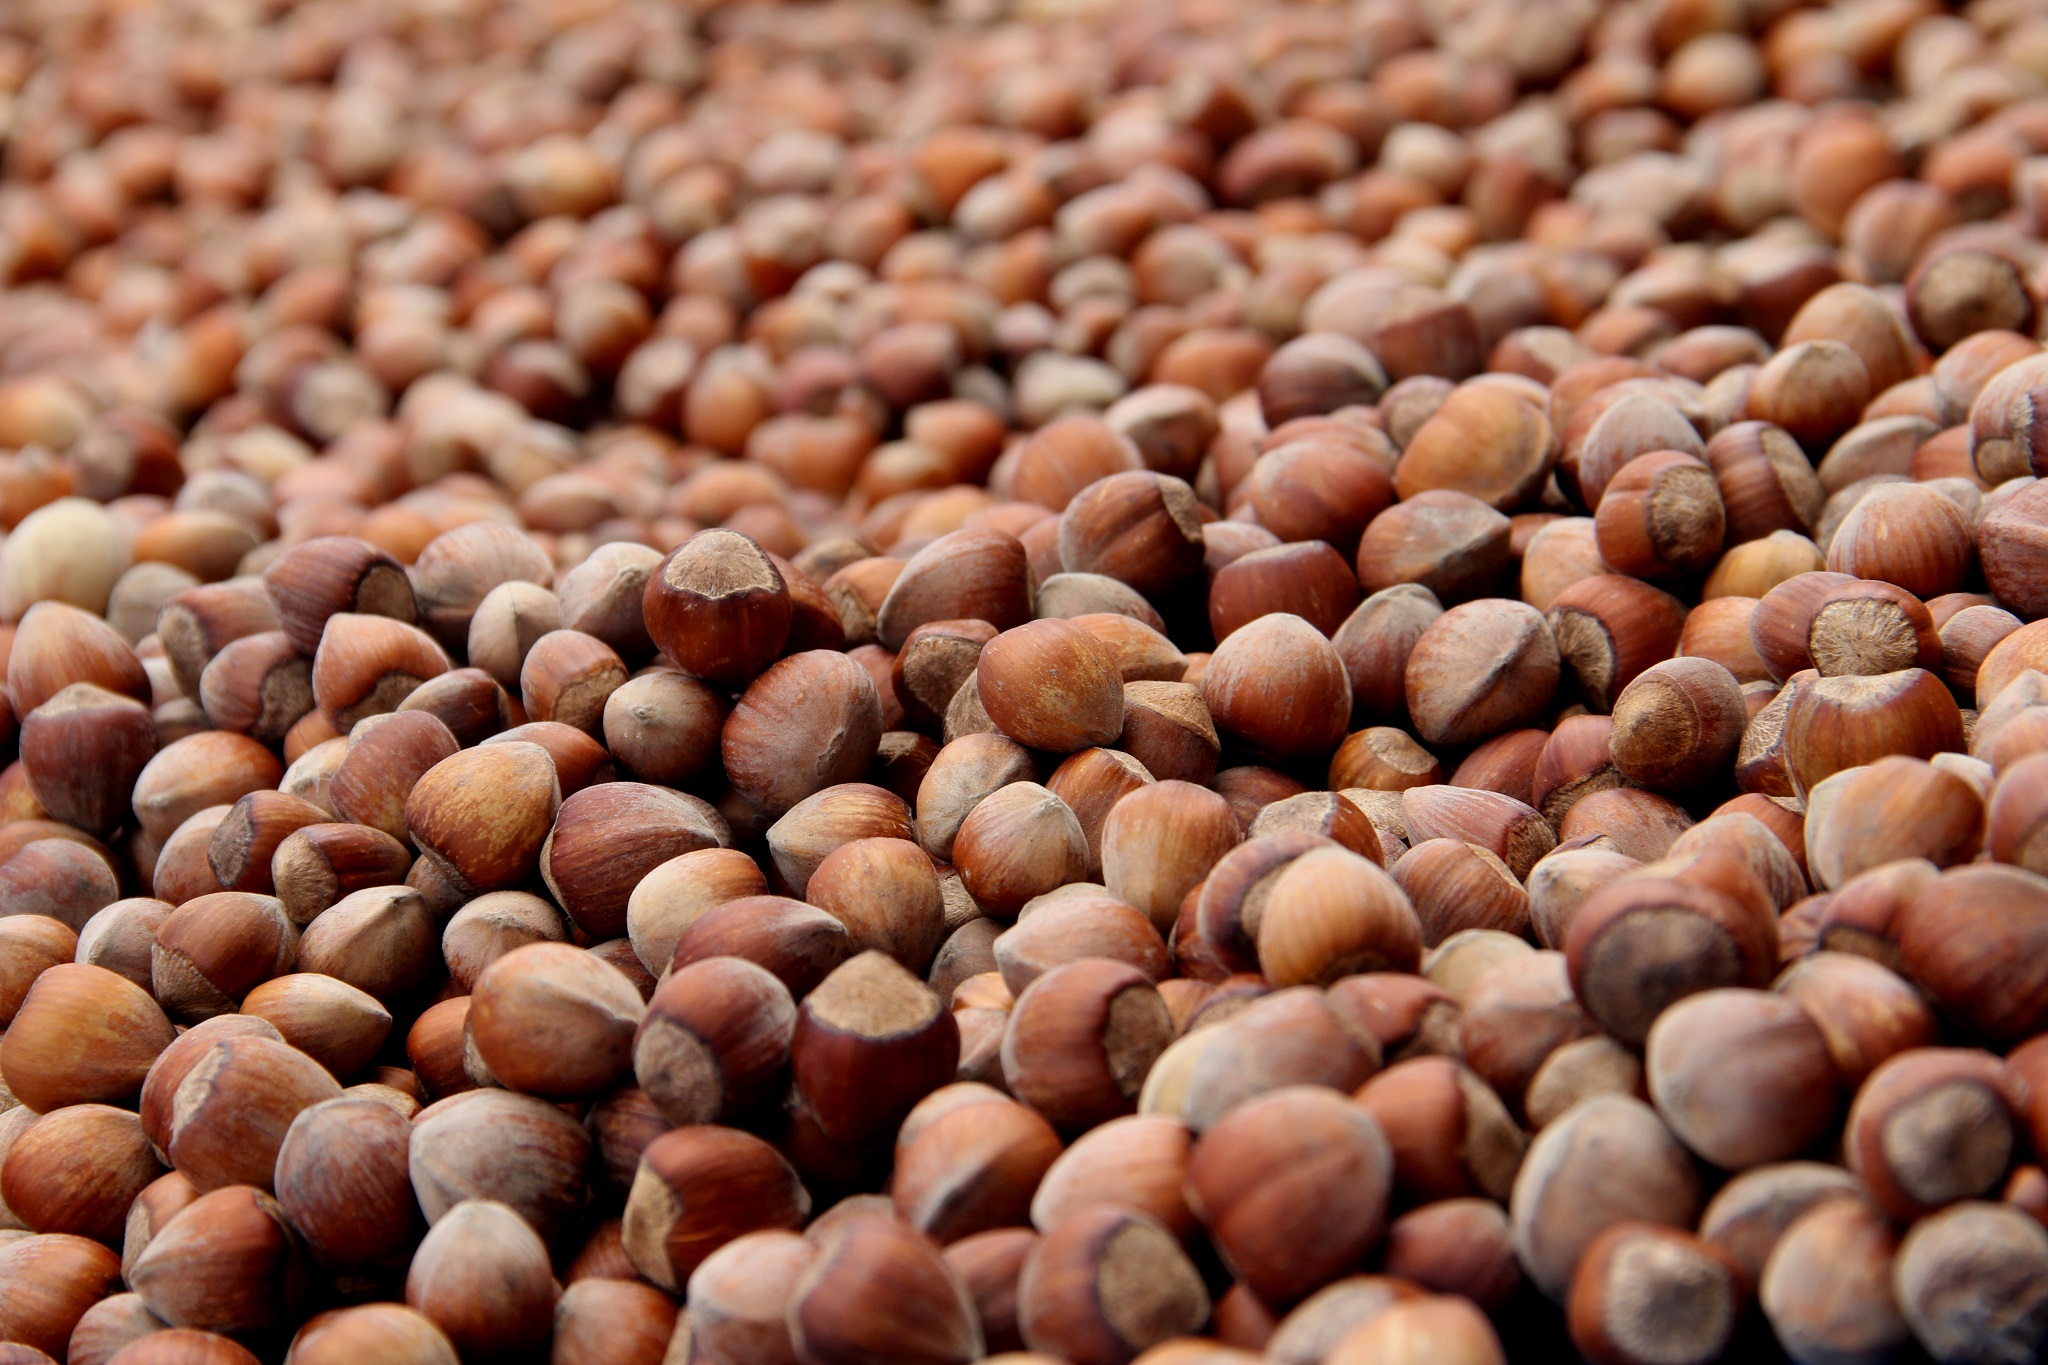
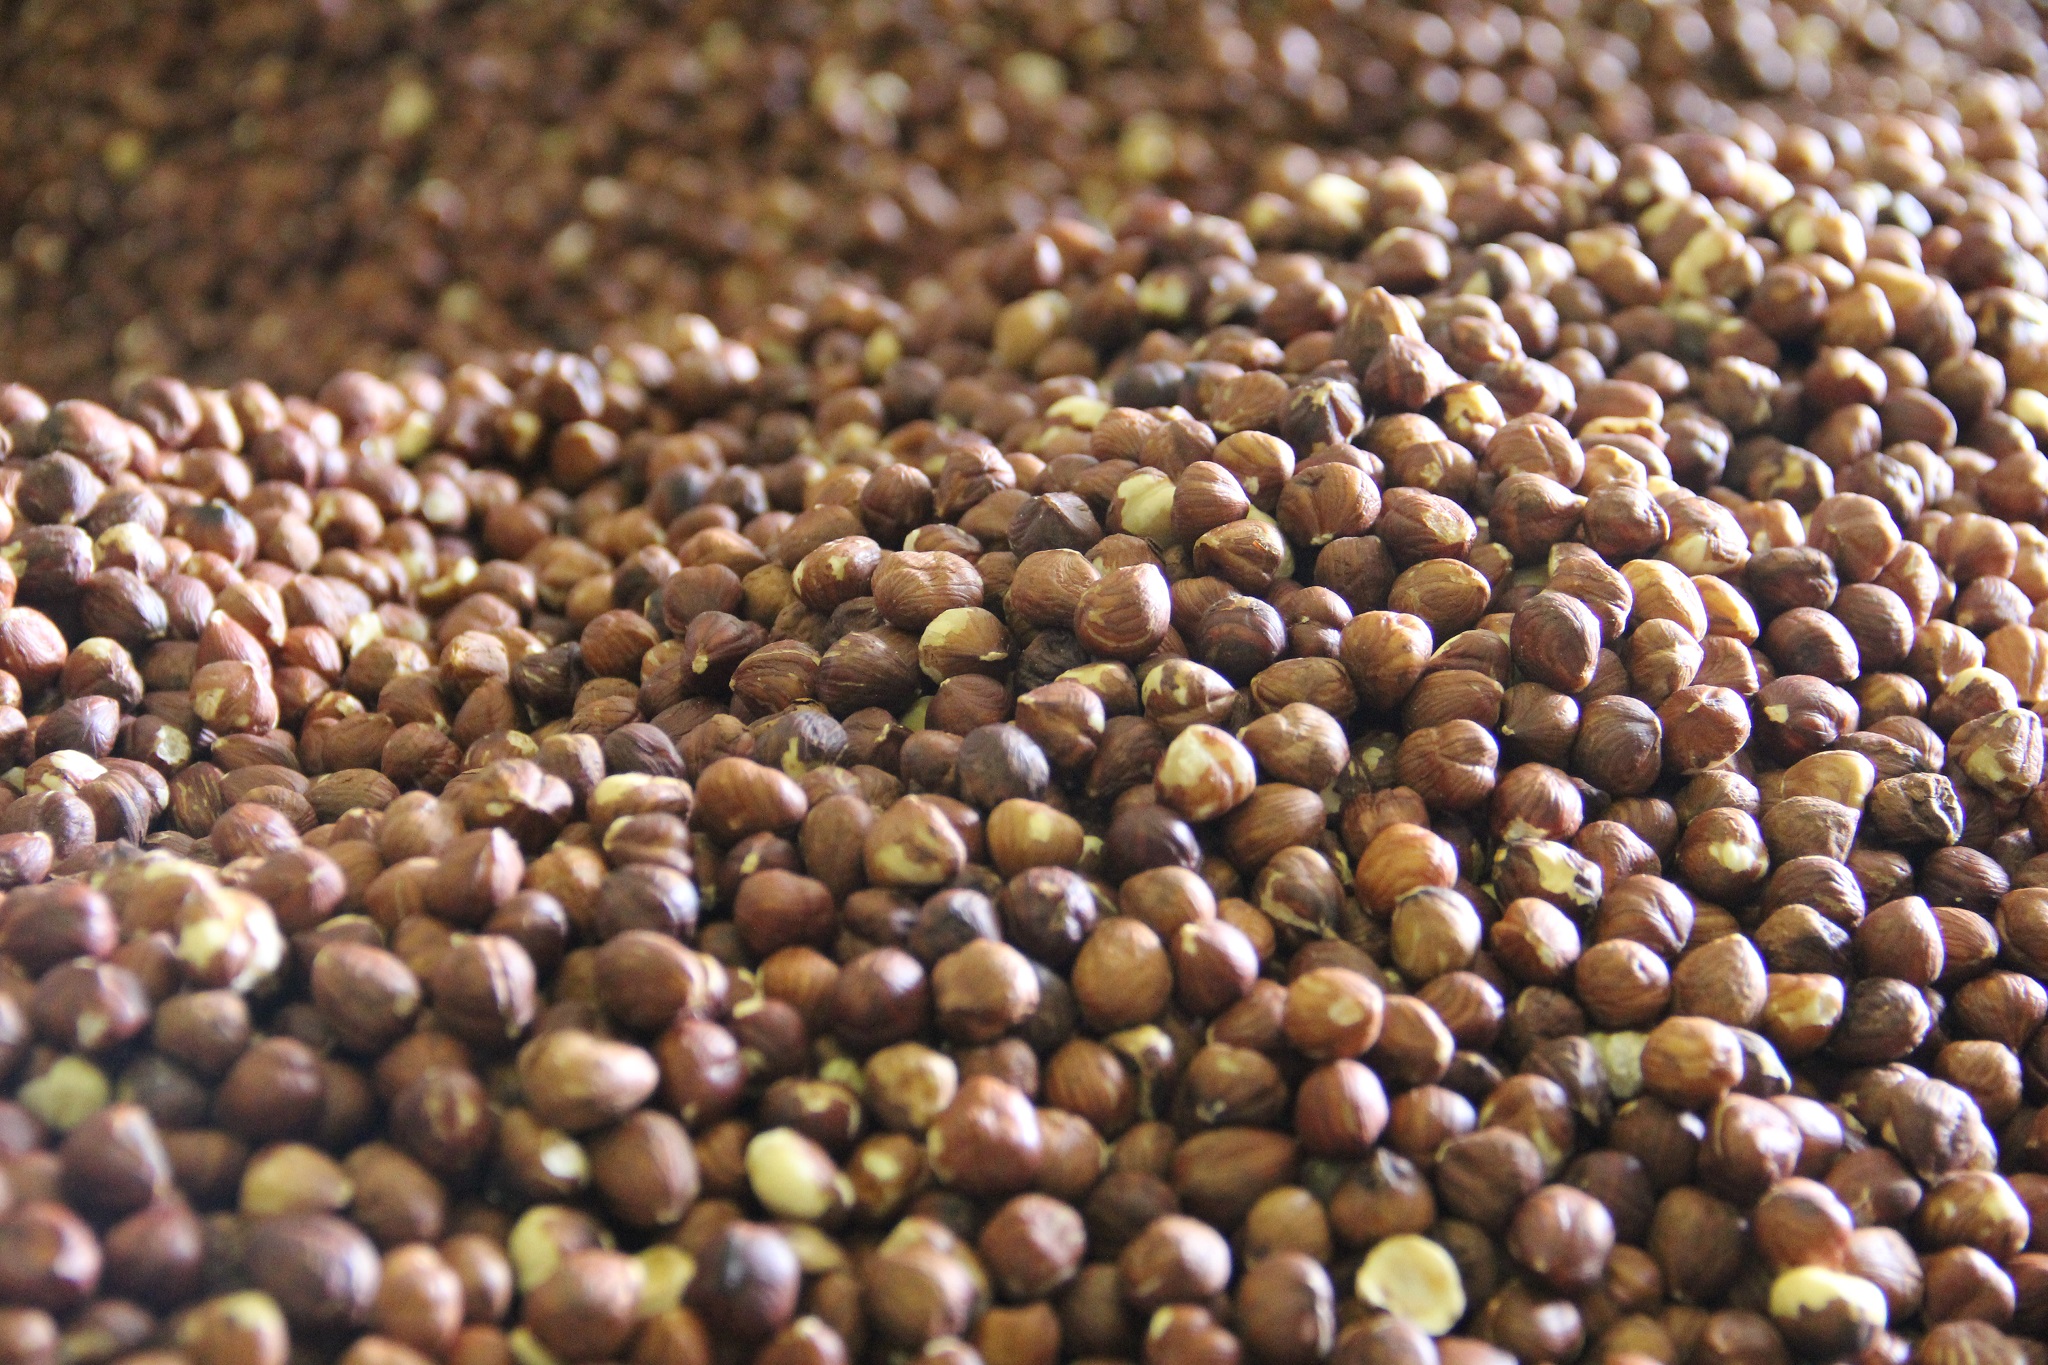
Turkiye, which holds a significant portion of the world’s hazelnut production and exports, has generated $37 billion in foreign exchange earnings from hazelnut exports over the past two decades.
According to data from the Black Sea Hazelnut and Products Exporters' Association (KFMIB), a total of 5,307,372 tons of shelled hazelnuts were exported between 2005 and 2024, yielding $37,537,437,207 in foreign exchange.
The highest volume of exports was recorded in 2021, with 344,370 tons of shelled hazelnuts exported. In terms of revenue, 2015 set a record with $2,887,316,418 earned.
In 2024, the second-highest figures in terms of both volume and revenue were achieved, with 323,244 tons of shelled hazelnuts exported, generating $2,635,868,856.
Producing More, Earning More
Trabzon plays a significant role in Turkey’s hazelnut exports.
Chairman of the Board, Eyyüp Ergan, emphasized that hazelnuts are Turkey's top agricultural export product that brings in net foreign exchange earnings without any import costs. He stated, “When we increase production from the current average of 700,000 tons of shelled hazelnuts across 750,000 hectares of land, we will be able to sell more and earn more. Hazelnuts are truly a golden asset for us."
Chairman Ergan noted that the Chamber has been implementing projects to improve hazelnut yield and quality for nearly 20 years, yielding positive results. He pointed out that increasing the average yield from below 100 kg per decare to at least 150-200 kg could significantly boost export volumes and foreign exchange earnings sustainably.
Turkey’s Hazelnut Exports Over the Last 20 Years
| Year | Tons-Shelled | USD Earnings |
|---|---|---|
| 2005 | 209,364 | $1,928,378,000 |
| 2006 | 247,186 | $1,467,017,317 |
| 2007 | 233,138 | $1,519,478,325 |
| 2008 | 228,401 | $1,407,871,663 |
| 2009 | 219,354 | $1,172,597,746 |
| 2010 | 252,305 | $1,544,785,708 |
| 2011 | 243,766 | $1,759,162,313 |
| 2012 | 265,714 | $1,802,462,907 |
| 2013 | 274,657 | $1,767,276,552 |
| 2014 | 252,528 | $2,314,253,067 |
| 2015 | 240,137 | $2,887,316,418 |
| 2016 | 227,556 | $1,981,334,911 |
| 2017 | 269,623 | $1,866,877,685 |
| 2018 | 279,250 | $1,635,235,672 |
| 2019 | 319,772 | $2,028,727,972 |
| 2020 | 280,924 | $1,945,299,937 |
| 2021 | 344,370 | $2,260,105,304 |
| 2022 | 312,564 | $1,748,835,811 |
| 2023 | 283,519 | $1,864,551,043 |
| 2024 | 323,244 | $2,635,868,856 |
| Total | 5,307,372 | $37,537,437,207 |
- *2021 marked the highest export volume.
- **2015 achieved the highest revenue.